Bol.com is a retail platform with over 12 million customers in the Netherlands and Belgium. To serve the needs of these customers, it is essential that our team provides accurate forecasts to empower business decisions on a day to day basis. With the outbreak of the COVID-19 pandemic, online shopping behaviour went through a major shift and demand for essential and non-essential products swiftly increased (see cbs).
After months of struggling with producing any reasonable forecasts, we managed to design a feature which is able to describe the dynamic changes associated with the COVID-19 pandemic. The addition of this feature allows us to provide reliable forecasts in the short term and roll-out scenario forecasting for the long term, supporting different domains across the business. Our approach is easily interpretable and explainable to stakeholders, leading to better data driven decisions.
In our forecasting landscape, we provide different types of sales forecasting, both on total level and also on product level. These forecasts are then used on their own for different purposes across the organisation but also used by our team as the main drivers for operational planning forecasting. The different forecasts rely on different time-series modelling techniques, from linear models to gradient boosting algorithms. As such, it was important for us to have an one-size-fits-all solution which could scale across the different modelling approaches.
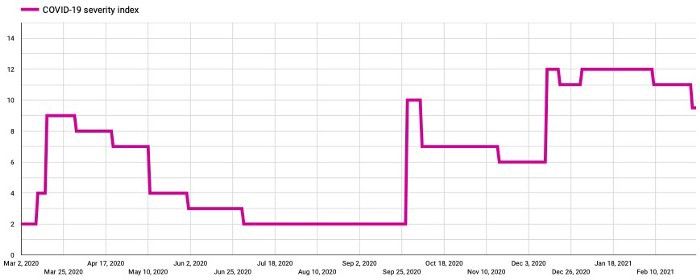
We started with an extensive data analysis and reading on the information regarding COVID-19 restrictions to contain the spread of the virus. With this information we developed a severity index that translated the impact of the pandemic on our sales patterns. Our severity index ranges between 0 and 12, where a 0 represents no COVID-19 related restrictions and a 12 represents the tightest restrictions we encountered during the pandemic. Figure 1. shows a representation of the COVID-19 severity index.

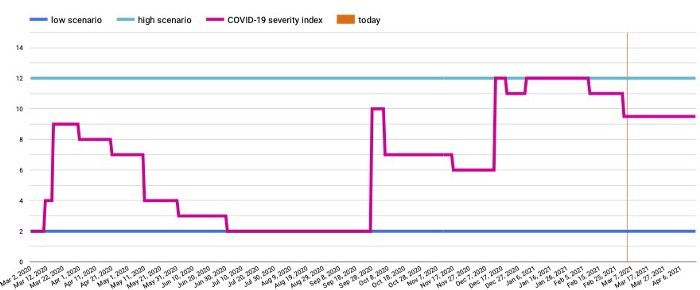
This COVID-19 severity index is similar to the publicly available COVID-19 stringency index (available here). The main difference is that our severity index is tailored to the particular dynamics of the influence of the pandemic on our sales data, which is not just dependent on the type of restrictions in place. For example, the implementation of compulsory mouth masks in public transport, or the temporary closing of physical shops has a higher effect on our sales pattern than what the already available stringency index would suggest. Creating our severity index also allows us to more easily translate the new information on restrictions from press-conferences into a future looking index, which is fundamental for forecasting. In addition, we are able to create upper and lower bounds for the severity index based on the previous months data and with this enable scenario forecasting.
Since the COVID-19 severity index is just a time-series feature, it is straightforward to implement it across the different modelling approaches in our landscape. The results of adding the severity index to our models were impressive, where we saw up to 40% relative improvement on the mean absolute error of the validation period (from March 2020 to Jan 2021). On top of that, the forward looking forecasts also began to be way more in line with expectations, which gave our stakeholders a meaningful forecast accounting for the latest pandemic dynamics and as a result also increased their trust in our predictions.
For long term planning, we also aided our stakeholders by providing different scenario forecasts, each one based on a different possible outcome of the pandemic. In this process, stakeholders could request a scenario based on a reference period for which we would then extend the severity index using the same values of that period and forecast the sales accordingly, see Figure 2.

During this period, we worked in even closer collaboration with our stakeholders than before, making sure to take their expert knowledge into account to decide on the future values for the severity index. The fact that the severity index is easily understandable makes this approach very transparent which resulted in a swift adoption of the improved forecasts.
From supply chain to logistics operations and customer service planning, our solution to forecasting demand during a pandemic has allowed us to provide reliable forecasts to empower business decisions in the short term, and roll-out scenario forecasting for the long term. We may not know yet what the future of the pandemic looks like, but we are now much better prepared.
*This work was developed as a joint effort from Team Forecasting at bol.com by Asparuh Hristov, Bjarnthor Egilsson, Cátia Silva, Erik Mulder , Eryk Lewinson, Roberto Carcangiu, Susanne Tak, Tavis Gravatt, Thijs Roukens and Wander Wadman.